The Minerals Local Plan policies map shows the geographical application of the various policies in the Minerals Local Plan.
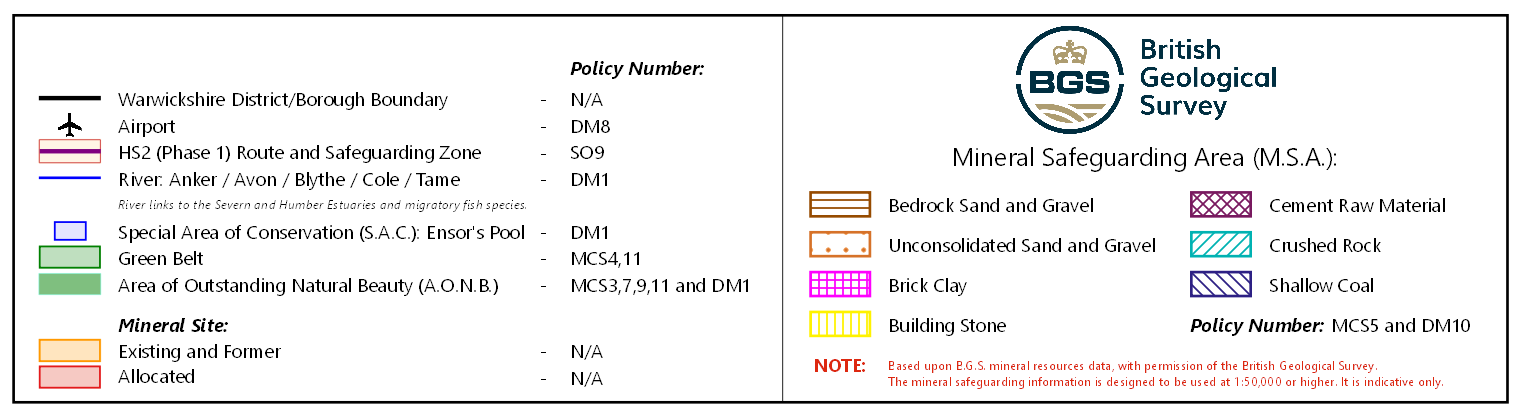
Map legend
If the map above is not loading for you, the policies map can be viewed via maps.warwickshire
Using the map
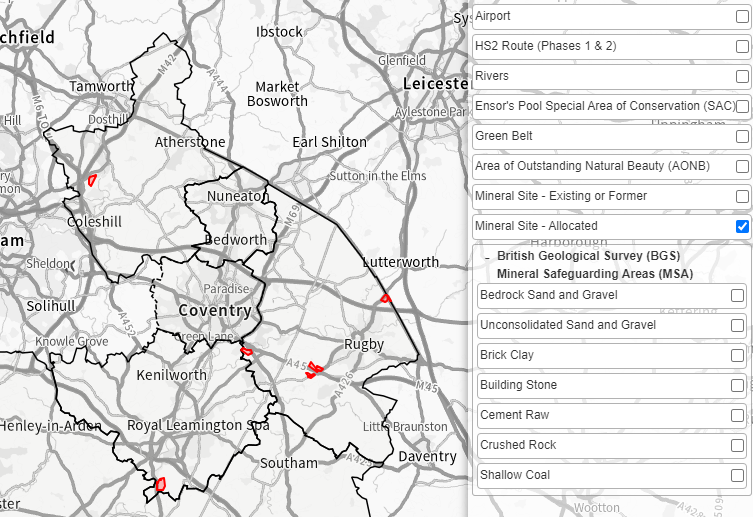
- To zoom in & out of the map use the + or – buttons on the map or your mouse scroll wheel.
- To move and pan around the map, click, and drag the map in any direction.
- The map legend shows all the policy layers.
- Click the boxes (on or off) in the map legend to highlight the layers required.
- Click on + British Geological Survey (BGS) in the map legend to reveal the mineral safeguarding areas (MSAs)
- Click the label again to close the layer.
Based upon the BGS mineral resources data and with the permission of the British Geological Survey, the mineral resource data is designed to be used at scales at 1:25,000 or higher and will not be displayed at smaller scales. The data should be considered indicative only and not used for decision making.